
EE features powerful 2D and 3D visualization capabilities for model pre- and post-processing. You can view the initial conditions and/or model result for any water column constituent, sediment bed constituent/property, or boundary condition. With zooming and panning tools, these can be displayed according to any spatial scale and perspective. Each display option has multiple sub-options that allow you to better understand and demonstrate the behavior of your model in relation to the actual physical conditions, supporting informed decision-making by engineers, scientists and regulators.
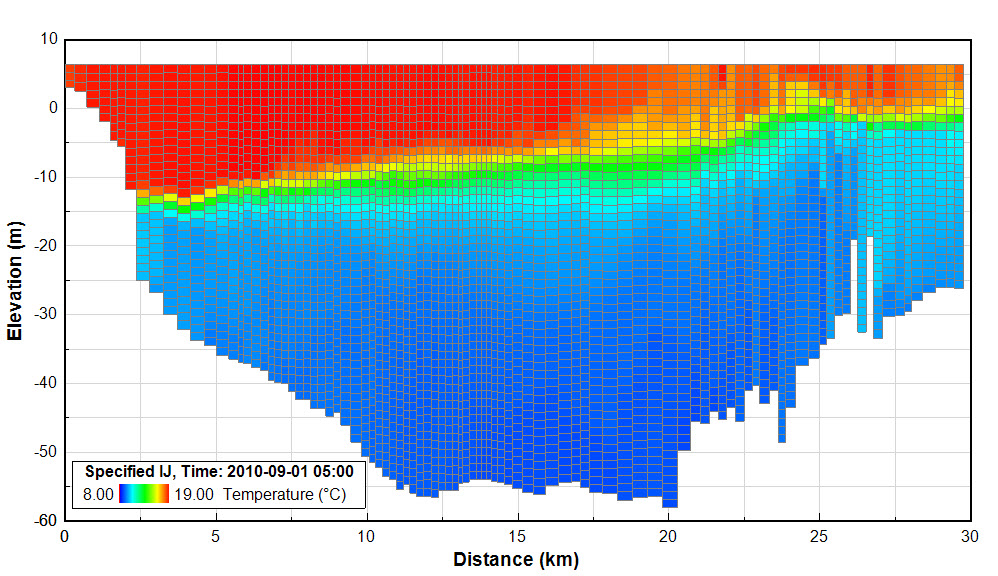
EE has impressive 3D visualization features, including slices through the X, Y, or Z plane, blanking by user-configured parameter values, fly throughs, and much more.
In the example shown, a model of Lake Washington is blanked along the I axis at a single snapshot in time to visualize the temperature profile in this vertically stratified system. High-quality visualizations assist you in professionally presenting and reporting model results.
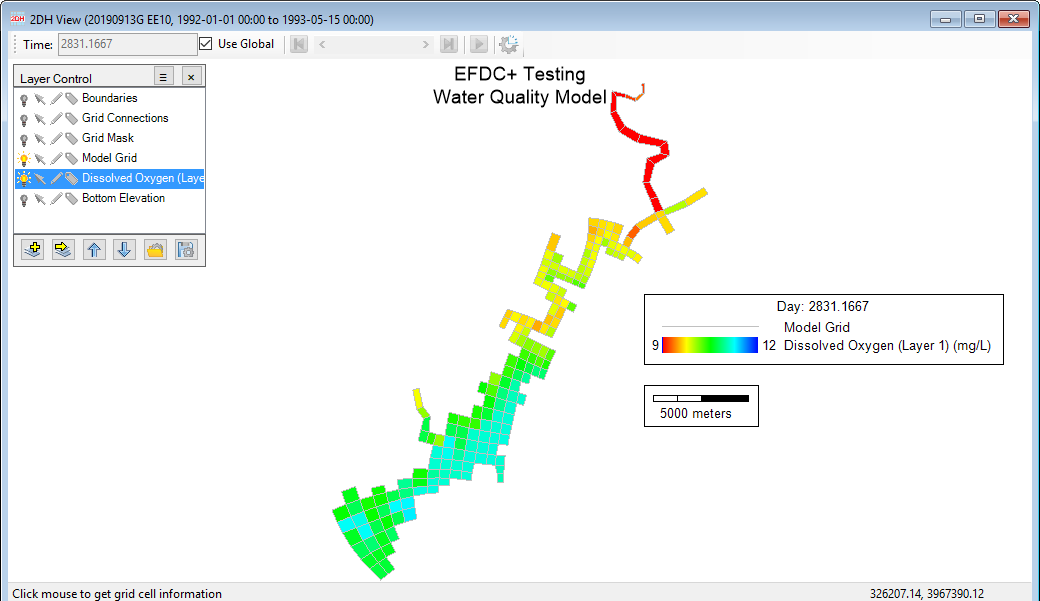
Using the 2D map view of the domain, you can view the model by layer or at a specific depth or elevation. When viewing by layer, you can opt to view the parameter as depth-averaged or by each vertical layer individually. The image to the left shows an example of dissolved oxygen in the bottom model layer.
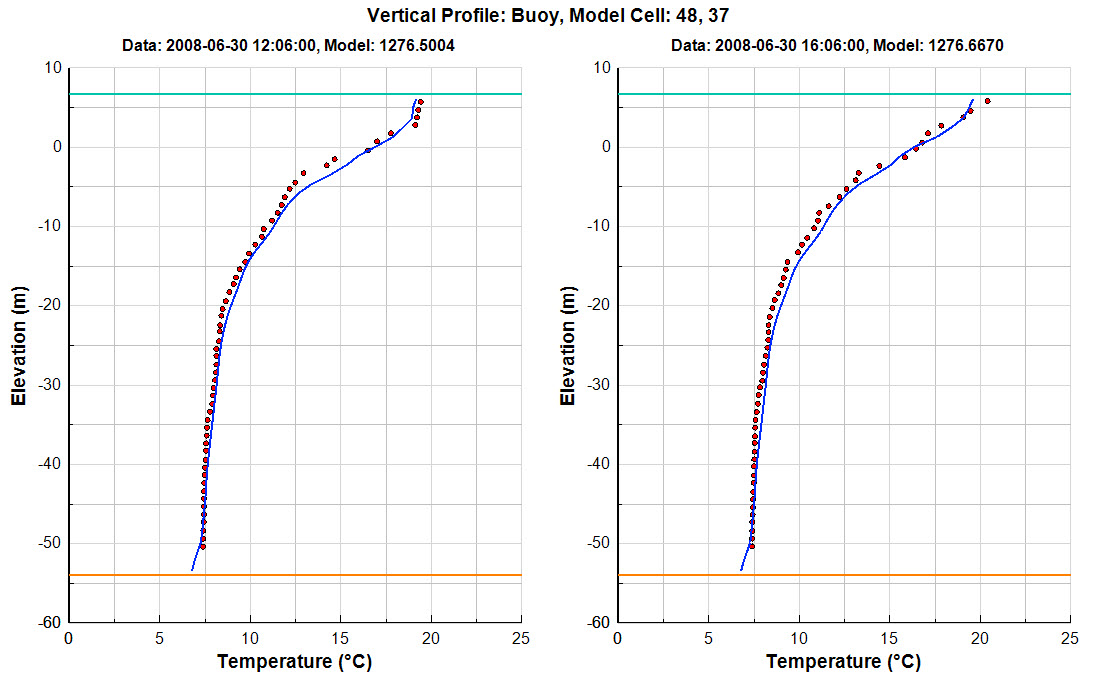
Vertical profile plots are essential elements for calibration and analysis when developing models for water bodies with stratification in the water column. Using EE, you can quickly generate these plots, with one or more locations shown on the same plot.
EE supports display of a vertical profile slice or cross-section cut through the model domain for most parameters such as velocity, sediment, or dissolved oxygen. This vertical slice can be along any I or J axis or can follow a user-defined path through the model. This allows you to conduct detailed analysis of the model performance over time.
EE offers robust capabilities for extracting and displaying longitudinal profile plots for any parameter in the 2D map view. These are similar to vertical slicing, but produce XY line plots for any layer or combination of layers along the profile for any given parameter.
[simpay id=”6281″]
[simpay id=”6276″]
Your support ticket has been successfully submitted. We will get back to you as soon as we can.